Learning about KOL meeting preferred frequency with Medical Science Liaisons, that is when Thought Leaders can or want to meet MSLs, is an important component of building trust in the MSL-KOL relationships. Since most of the organizations’ field teams coordinate and set the pace for these interactions, it becomes increasingly important to understand what Thought Leaders are looking for in a relationship. That way, MSLs and medical affairs management can better design their approach to meeting with Thought Leaders.
Barring distinct initiatives and work collaborations that require more intense communications, too many interactions may cause Thought Leaders to start pushing back and eventually, completely closing the door to visits. On the other hand, if the frequency of visits drops, Thought Leaders may get involved with competing organizations more in tune with their needs. To avoid these risks, knowing the pace at which Thought Leaders prefer to meet is invaluable knowledge.
Recent research done to assess KOLs’ preferences shows a significant change in their expectations when it comes to meeting with Medical Science Liaisons. When compared to research conducted five years prior, the data shows that more than 35% of surveyed KOLs shifted their preferred pace of interaction from an intense monthly to “every 2 to 3 months” to “as needed” as shown in the figure below.
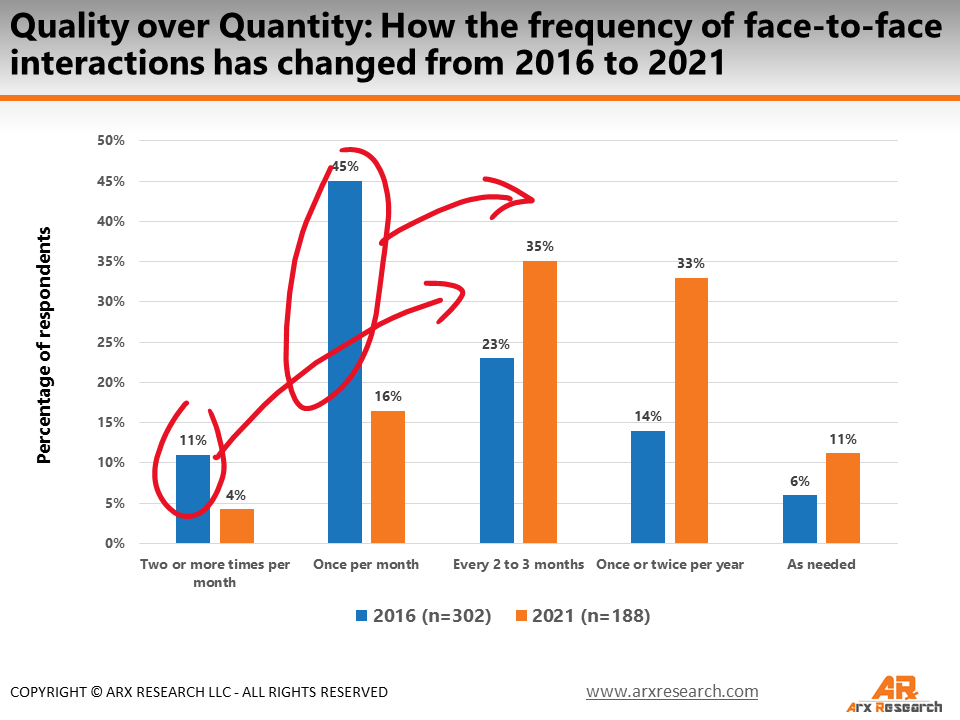
Then, more than half, or 56%, of surveyed KOLs preferred meeting monthly or more often while the most recent data indicates only 20% now prefer meeting at these paces*.
And while the data shows a desire from KOLs to meet less often than before, it is important to note that the traditional face-to-face meetings experienced a transformation and have partly transitioned to virtual modes (see here for research insight), mostly due to the effect of the pandemic, but also through the realization that virtual interactions can be, in some cases, as effective as face-to-face.
The combination of diminished KOL meeting frequency, in addition to the use of virtual exchanges, frees up a remarkable amount of time for MSLs (a lot less travel, preparation and, meeting time). We see in this insight two opposing opportunities.
The first is that MSLs could take on additional Thought Leaders. Our research suggests that a single MSL will typically maintain 30 to 35 Thought Leader relationships (this used to be 50ish circa 2010). Purely based on numbers, if 35% of KOLs now prefer meeting every 2-3 months instead of monthly, could the KOL list be augmented by another 10 to 12 relationships?
The second opportunity we see is a vast opening of time for improving the quality of each relationship. MSLs can now dedicate additional time to tailor a strategy for each of their relationships to uphold the highest level of excellence and ensure a paramount experience for each Thought Leader.
So, let’s think about this for a second. MSLs already had (in pre-pandemic times) a full plate “entertaining” 30+ KOLs all year long. Although there is now “new” time found, an additional 10 relationships to maintain might not be reasonable to assume. On the flip side, MSLs already work hard to establish the highest quality relationships, juggling between an ever-increasing amount of clinical data, scouring publications, identifying KOL activities, facilitating research, and so on. Conceivably, adding a few, maybe 3 or 4 new relationships to their roster, mixed with a renewed focus on excellence might be a better approach to fill that freed time.
The last few years have altered how Medical Science Liaisons operate moving forward and one of the key components of healthy exchanges is to understand KOL meeting expectations. Arx Research conducts customized Thought Leader Feedback Surveys, a straightforward process to gather key information directly from the KOLs with which the MSL team members interact. The feedback provides essential information to help realign reach-out efforts, ensure a streamlined operation, and ground MSL-KOL relationships. Learn more here: KOL Feedback Surveys
